Primer
How to read a GEX chart — one bar, two walls, one number
Memorize the two longest bars and you'll be stuck the day two providers show floors 1,000 points apart. What one bar means, how walls are picked, and why net GEX has a size as well as a sign — read through three real sessions.
Open a GEX chart for the first time and you get a few dozen bars. Some point up, some point down, some long, some short.
Most people pick out the two longest bars, label them "ceiling" and "floor," and move on. That's a reasonable start. But it leaves you stuck the day two data providers show you floors more than 1,000 points apart on the same morning. That day happened, and it's in section 4.
This piece reads the chart in three steps:
- One bar — what a single bar actually represents
- Two walls — how the call wall and put wall are picked
- One number — the sign and the size of net GEX
Then it checks three traps against real numbers from 1–5 October 2026.
📎 Why dealers sell into rallies and buy into dips — the path from delta to GEX, and the four assumptions GEX rests on — is in Gamma flip — why the same news gets absorbed on one day and amplified on the next. This piece builds on that one.
1. One bar, one strike
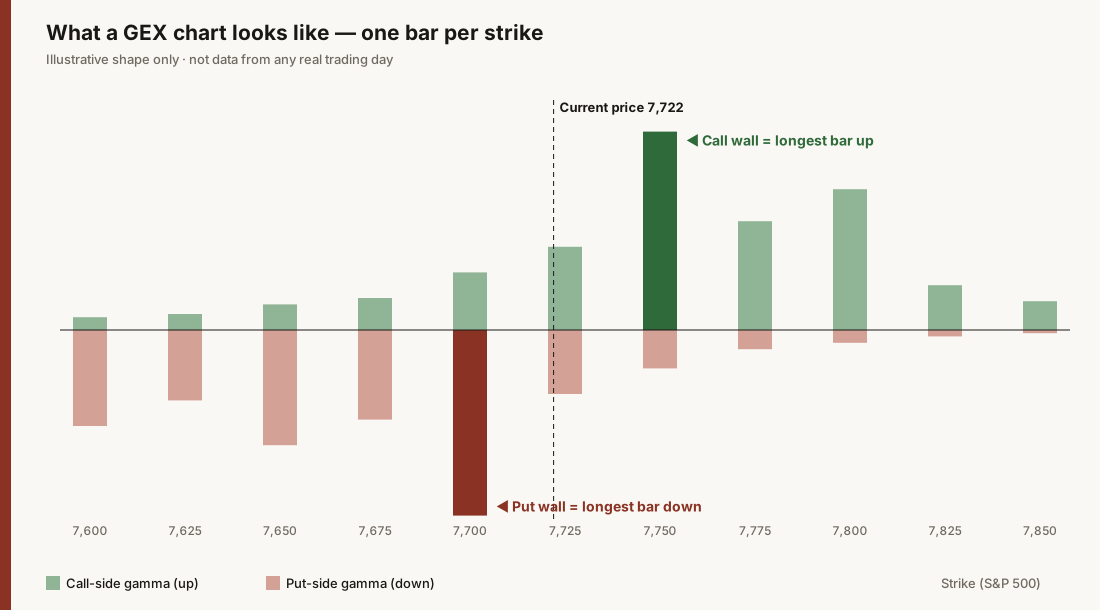
An illustrative shape, drawn to explain the layout. Not data from any real trading day.
- The horizontal axis is strike price, not time. This isn't a price chart that flows left to right. It's a snapshot of what is sitting at each price level right now
- Each bar is the total gamma of the options at that strike — roughly, open interest at that strike times the gamma of those options
- Bars above the line come from calls; bars below come from puts (this is for charts that plot calls and puts separately; some providers show a single net bar per strike)
In one sentence, a bar's length tells you:
How much dealers would have to buy or sell to stay hedged if the index moves around that strike.
The longer the bar, the busier dealers get at that price. So a GEX chart doesn't tell you where the market is going. It tells you where dealers will be busiest if it gets there.
Why calls go up and puts go down
That's a convention, not an observation. The SqueezeMetrics white paper that named and published GEX assumes dealers are long the calls and short the puts, so call gamma is counted as positive and put gamma as negative (white paper, March 2016, revised December 2017).
There are days when that assumption doesn't hold; the earlier post covers them in section 6. For now, keep one thing in mind: up and down are a sign convention, not a view into dealers' actual books.
2. Two walls — the call wall and the put wall
| How it's picked | What people usually take it to mean | |
|---|---|---|
| Call wall | The strike with the longest bar up | Where dealer hedging can lean hardest against a rally → "resistance" |
| Put wall | The strike with the longest bar down | Where downside hedging is heaviest → "support" |
That's the whole definition: pick the longest bar.
Two things follow from that:
- A wall is the longest bar, not a long bar. Even on a day when every bar is short, one of them is still the longest. On those days the wall is a wall in name only
- "Resistance" and "support" describe a tendency, not a promise. A wall marks where price can stall, not where it will. Section 6 has a day it gave way
3. One number — net GEX
Add up every bar and you get net GEX. Call bars count up, put bars count down, so the total can land on either side of zero.
| Sign | What it says about the session |
|---|---|
| Positive (+) | Dealer hedging tends to dampen moves — selling strength, buying weakness |
| Negative (−) | Dealer hedging tends to amplify moves — buying strength, selling weakness |
The part beginners most often skip is the size.
By sign alone, +1 and +20,000 are both "positive gamma." They don't make the same kind of session. Here are two real mornings from my own records:
📅 Observation — same calculation, two mornings (my own calculation · 0DTE · pre-market values)
Date Net GEX Morning note Thu 2026-10-01 −22,304 Negative gamma Mon 2026-10-05 +1,188 Positive gamma — but very close to zero By sign, 5 October was a "dampening" day. By size, it was about 5% of 1 October's reading. When the absolute value of net GEX is below 2,000, I log the gamma regime as "undetermined" for that morning. 5 October was one of those days.
⚠️ Only compare numbers from the same source
GEX units differ from provider to provider. The original white paper defines it as the number of shares dealers would trade per 1-point move in the index. Many services convert that into dollars per 1% move. Which expirations get included, and how far from the current price the strikes run, also vary.
The −22,304 and +1,188 above are calculated in-house by the app I use, from same-day-expiring (0DTE) options only, so they can't be lined up against a figure like "GEX +$5B" from another site. I only compare today with yesterday from the same source.
4. Trap 1 — two put walls 1,000 points apart, same morning
On the morning of 5 October, here are the walls from two calculations on the same S&P 500 options:
📅 Observation — 2026-10-05, before the open (prior close 7,722.72)
Unusual Whales (data provider · all expirations) My own calculation (0DTE · same-day expiry only) Call wall 7,800 7,750 Put wall 6,585 7,700 Gamma flip 7,720.08 7,710 The put walls are 1,115 points apart. The Unusual Whales put wall at 6,585 sat about 1,138 points below the prior close.
Neither one is a calculation error. They're adding up different things.
The Unusual Whales put wall comes from open interest summed across all expirations (that was my app's diagnosis that morning). My own calculation does the opposite: it adds up only the options expiring that day (0DTE). Puts with months or years to run pile up at strikes far below the market, mostly as insurance. Add all of them together and the longest bar lands somewhere that has nothing to do with today's price. The index almost never moves 1,000 points in a session, so for anyone looking one day at a time, that wall is off the map. A 0DTE wall comes from options that expire that afternoon, so it usually sits close to the current price.
The two walls aren't two answers to the same question. They answer different questions — one is about all the options built up across the market, the other about the options that expire today.
So whenever I look at a wall, I write down two more things:
- How many points it is from the current price — if it's far beyond the day's expected move, I treat it as out of play for that session
- Which expirations it's built from — most providers show this. If they don't, I set it next to another source from the same day
5. Trap 2 — walls move from one session to the next
Walls aren't fixed lines. They're recalculated as open interest changes and the index moves.
📅 Observation — 2026-10-01 → 10-02 (one session later)
1 October close 7,666.45 → futures-implied open on 2 October 7,735.70 (+69 points)
10/1, 07:15 PT (45 min after the open) 10/2, pre-market Change My call wall 7,650 7,700 +50 My put wall 7,600 7,625 +25 Unusual Whales call wall 7,700 7,800 +100 Unusual Whales put wall 7,500 7,730 +230 All four walls moved up. Price moved up, and so did the walls.
Carry yesterday's "floor at 7,600" into today and you're looking at a floor that's already gone.
📌 My notes carry a working hypothesis: "flow moves the call wall; price moves the put wall." The +230 on the put wall above looks like an example of it, but it's still a hypothesis, not a tested rule.
6. Trap 3 — walls give way
Here are the walls from section 4 next to what price actually did on 5 October:
📅 Observation — 2026-10-05 result
Open High Low Close 7,730.86 7,794.35 7,727.59 7,773.95
- My call wall at 7,750 → broken. The high was 44 points above it, and the close finished 24 points above it
- Unusual Whales call wall at 7,800 → the high stopped 5.6 points short
- My put wall at 7,700 → never reached (the low was 27 points above it)
That morning's note read: positive gamma, but close to zero, so the magnet effect is weak too. And 7,750 didn't act as a ceiling.
Did the wall give way because net GEX was weak? One day can't tell you. Nor can it tell you whether stopping near 7,800 was the wall or coincidence. So I record what happened and stop there.
⚠️ This uses the daily bar only (open, high, low, close). It can't show which level was touched first during the session.
7. When I open the chart — the order I read it in
Put together, this is the order I read a GEX chart in:
| Step | Look at | The question |
|---|---|---|
| ① | Sign of net GEX | Is today a dampening day or an amplifying day? |
| ② | Size of net GEX | Is that clear, or is it near zero and blurry? (compare with yesterday, same source) |
| ③ | Where the call and put walls are | How many points from current price — within reach today? |
| ④ | Where the walls come from | Which expirations? If two sources disagree by hundreds of points, find out why first |
| ⑤ | What changed since yesterday | How far have the walls moved since yesterday? |
Direction isn't anywhere in this table. A GEX chart doesn't answer "up or down?" It answers "if price moves, where do dealers get busy?" That distinction is the most important line in this piece.
8. What I don't know yet
- I haven't counted how often walls actually stop price. The observations here span three sessions, 1–5 October. They're examples to calibrate the reading, not rules
- Whether the size of net GEX tracks the strength of the walls — I don't know yet. 5 October was "weak net GEX, call wall broken," and one day says nothing on its own
- Which walls are more useful for a single session — on 5 October alone, the Unusual Whales (all-expiration) call wall sat closer to the high, while the 0DTE put wall was at a realistic distance. The two measure different things, so this isn't a contest to score, least of all on one day
※ This piece describes how I read an indicator and my own observations. It is not investment advice and not a recommendation to buy or sell any security. The prices and levels quoted are from 1–5 October 2026, and GEX and the walls are recalculated every day. Options involve risk and are not suitable for all investors. You are responsible for your own decisions and their outcomes.
How was this to follow?
Knowing where it got hard is what lets me fix the next one. No name, no email.
Get the One-Page Options Field Guide
A strategy selector for bull, bear, and sideways markets, a pre-order checklist, and a glossary.
If this was useful
Why gamma, call walls, and put walls behave the way they do comes down to the structure of the options market. These books lay out that structure in order.
- Strategic US Options Trading I: Fundamentals — Start here if options are new — from reading the chain
- Strategic US Options Trading II: Strategies — When you want to actually place the order
- Strategic US Options Trading III: Advanced Strategies — When you want cash flow in a sideways market
Earlier posts live on Tistory. I'm moving them here a few at a time. optiontrading.tistory.com
Questions?
There are no comments or a guestbook here. Email me with questions about a post or to report an error — I read and reply. I don't give individual investment advice.
hello@optionphoenix.com