Theory
Backspreads and Naked Selling — The One Point I Look for First on a Payoff Chart
Structures with a big payoff have a spot where the chart dips deepest. For a backspread, that hole sits at the long strike. For a naked short call, there's no floor at all. I walked four structures all the way through with example numbers.
When I look at an options structure that's new to me, I don't start with the shape of the chart. I start with one point.
Where does the underlying have to finish at expiration for this position to lose the most?
Shapes are easy to memorize and just as easy to mix up. But once that one point is marked, the rest of the chart falls into place. This is my record of working out where that point sits in four structures with big upside and big risk — the call backspread, the put backspread, the naked short call, and the naked short put — carried all the way through with example numbers.
📌 The option prices in this post are example values chosen to illustrate the structure. They are not real quotes, and they leave out commissions, taxes, and margin. One contract covers 100 shares of the underlying (for an index, $100 per point).
1. The two places I look on a payoff chart
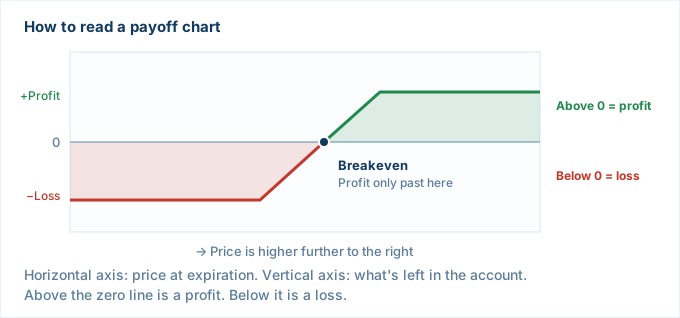
Every chart in this post is an expiration payoff. The horizontal axis is the price on expiration day; the vertical axis is what's left in the account at that moment.
I only look at two places.
- Where the line bends — that's a strike. It's where the character of the structure changes
- Where the line crosses zero — that's a breakeven
And one line goes underneath everything else. Whoever buys an option can lose only what they paid, and whoever sells one can make only what they collected. Depending on the structure, what the seller can lose may have no limit. Every reason these four structures are dangerous comes back to that one line.
2. A backspread sells one expensive option to buy two cheap ones
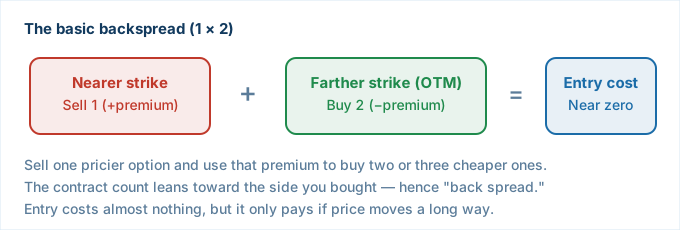
Options at a nearer strike are expensive; options at a farther strike are cheap. So selling one of the near ones pays for most of two or three of the far ones. The entry can cost close to nothing, and sometimes you're paid to put it on.
The price of that is a condition: the move has to be big. And that's where the first thing I check on this structure comes from.
1 option sold    → starts losing the moment price crosses its strike
2 options bought → only start paying once price goes farther still

In between       → the short side is already losing, the long side isn't working yet
That's why the chart dips into a V. The bottom of the dip is exactly the strike of the options you bought. If the direction is right but the move is only middling, that's exactly where the position ends up.
3. Call backspread — following the example numbers
I ran the numbers on a stock option. The prices are example values.
Sell  327.50 call × 1   @ 3.89   → +$389
Buy   330.00 call × 2   @ 2.99   → −$598
───────────────────────────────────────
Entry cost                          −$209  (about $210 paid)
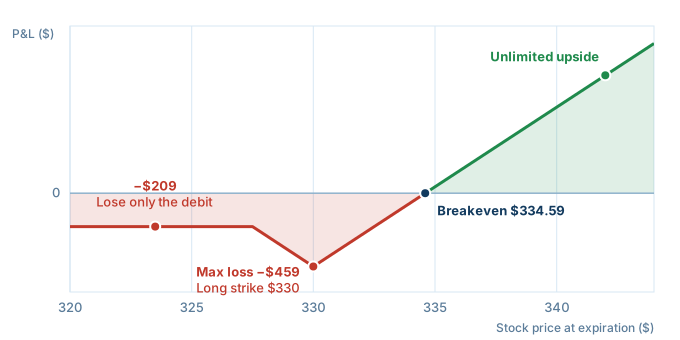
Here it is one expiration price at a time.
Expires 325   both calls worthless                  →  −$209  (just the debit)
Expires 330   short call  −(330 − 327.50) × 100 = −$250
              long calls  worthless                 →  −$459  ← max loss
Expires 340   short call −$1,250 · 2 long calls +$2,000  →  +$541
Breakeven is 334.59. Above that, profit keeps growing as price rises.
No rally, a small loss. A modest rally, the biggest loss. A big rally, a big gain. That middle line is the personality of this structure.
Why it doesn't look like the textbook picture
It's the same call backspread, but in a lot of reference material the flat section on the left sits above the zero line. In the chart above it sat below. Both are correct.
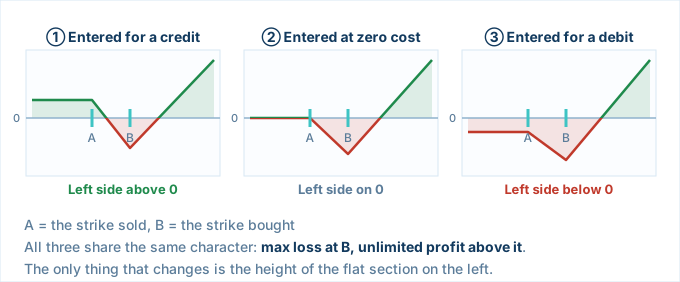
The only difference is whether the entry collected a credit or paid a debit. Most textbooks draw the version entered for a credit; the example above paid $210 to get in.
And that isn't something you pick — the day's quotes decide it. The closer the strikes, the closer the two option prices, and the more likely you pay a debit; the wider the strikes, the more likely you collect a credit. The first thing I look at on the order ticket is whether the net amount is a credit or a debit.
In all three cases the character is the same: maximum loss at the long strike, with profit that keeps growing above it.
4. Put backspread — the same structure, mirrored
Sell  330 put × 1   @ 9.34   → +$934
Buy   315 put × 2   @ 2.44   → −$488
─────────────────────────────────────
Entry                          +$446  (credit)
This time the position starts by collecting a credit. But whether that money is really mine isn't known until expiration.
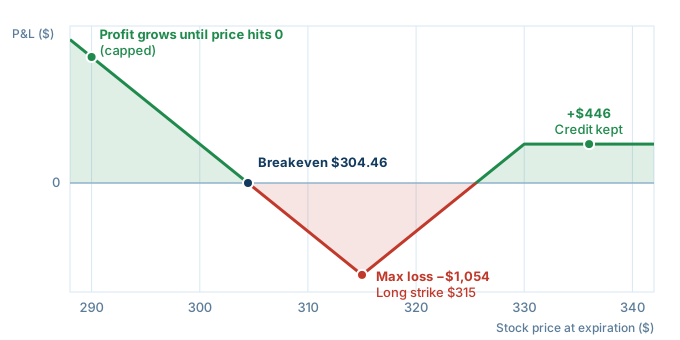
Expires 335   all puts worthless                    →  +$446
Expires 315   short put  −(330 − 315) × 100 = −$1,500
              long puts  worthless                  →  −$1,054  ← max loss
Expires 290   short put −$4,000 · 2 long puts +$5,000   →  +$1,446
Breakeven is 304.46.
Two things I want to flag here. Both tend to get muddled in write-ups of this structure.
- The downside profit is not unlimited. Price can't go below zero, so in this example the theoretical maximum is about $30,446
- A put backspread is also a bet on volatility going up. Call or put, a backspread is positioned for a big move and rising volatility
5. Naked selling — nothing behind it
In a backspread, the long options act as a backstop. Naked selling has nothing backing it. The name describes the condition exactly.
Naked short call
Selling the $24 call on a $23 stock for $0.50.
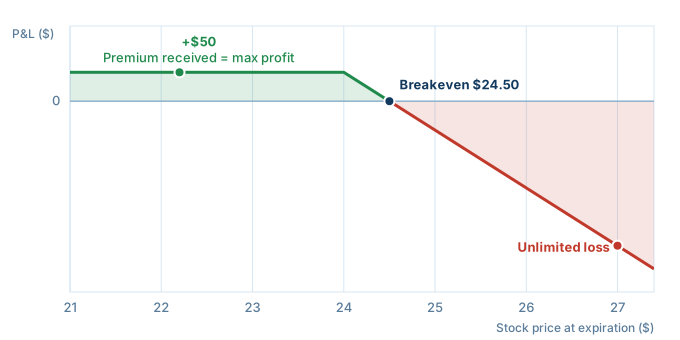
Expires $23     call worthless                →  +$50   ← max profit
Expires $24.50  the $50 collected is gone     →   $0
Expires $30     −(30 − 24) × 100 + $50        →  −$550  (keeps growing as price rises)
There's no ceiling on price. So once the call is sold without cover — shares you own, or a farther call you bought — there is no ceiling on the loss either.
Naked short put
Selling the $42 put on a $45 stock for $0.75.
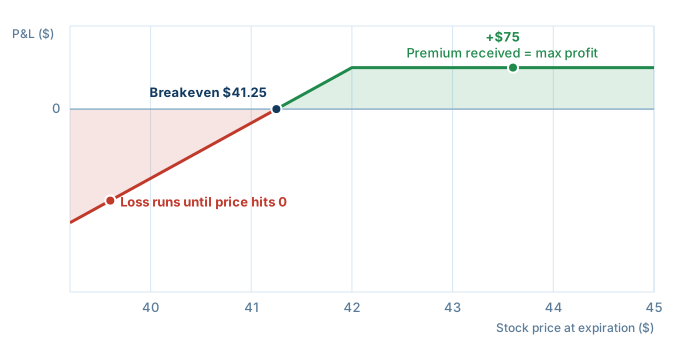
Expires $45     put worthless                 →  +$75   ← max profit
Expires $41.25                                →   $0
Expires $35     −(42 − 35) × 100 + $75        →  −$625
Expires $0      −42 × 100 + $75               →  −$4,125
The chart has exactly the same shape as a cash-secured put. What differs is what's set aside. A cash-secured put is sold with the full assignment amount already sitting in cash, on the premise that "I'm fine owning the shares." A naked short put is backed only by margin, and the goal is the premium. When a sharp drop comes, the first gets the shares; the second gets a margin call.
Things that actually happened
- OptionSellers (November 2018) — an investment manager that sold naked calls on natural gas futures and naked puts on crude oil futures in size. In under a week, natural gas spiked and crude fell hard, and client accounts lost more than they had put in (CNBC)
- Melvin Capital (January 2021) — this one wasn't option selling at all. It was a short position in GameStop stock. The fund lost 53% in a month (CNBC). Different instrument, but the same character as a naked short call in one respect: a position whose loss to the upside has no limit
6. The four structures in one table
| Structure | Move it's positioned for | When it wins | Where it loses the most |
|---|---|---|---|
| Call backspread | Sharp rally · rising volatility | A big move up | Finishing exactly at the long strike |
| Put backspread | Sharp drop · rising volatility | A big move down | Finishing exactly at the long strike |
| Naked short call | Sideways · falling volatility | Price doesn't rise | A sharp rally — no limit |
| Naked short put | Sideways · falling volatility | Price doesn't fall | A sharp drop — all the way to zero |
7. The five lines I write before placing the order
- Have I written down this position's maximum loss in dollars?
- Could I actually lose that amount without it affecting my daily life?
- At what price does the maximum loss happen — for a backspread, the long strike?
- Did I set my exit criteria — the point where I close it — beforehand?
- Am I holding to expiration, or closing it along the way?
Boiled down to two sentences: A backspread's maximum loss happens at the strike you bought. With naked selling, what you collect is fixed; what you can lose is not.
Even within backspreads, it's easy to get confused about which side you're selling, so I wrote that up separately — Backspreads and ratio spreads: price decides which side you sell. The math for choosing strikes on a long-dated index position is in The two strikes of a long-dated put backspread.
⚠️ This is a record of how I read and calculate options structures. It is not investment advice and does not recommend any security or strategy. The prices in this post are examples for illustration only. Options trading can result in the loss of your entire investment, and naked option selling can result in losses greater than the amount initially invested. Your decisions and their outcomes are your own.
How was this to follow?
Knowing where it got hard is what lets me fix the next one. No name, no email.
Get the One-Page Options Field Guide
A strategy selector for bull, bear, and sideways markets, a pre-order checklist, and a glossary.
If this was useful
Why gamma, call walls, and put walls behave the way they do comes down to the structure of the options market. These books lay out that structure in order.
- Strategic US Options Trading I: Fundamentals — Start here if options are new — from reading the chain
- Strategic US Options Trading II: Strategies — When you want to actually place the order
- Strategic US Options Trading III: Advanced Strategies — When you want cash flow in a sideways market
Earlier posts live on Tistory. I'm moving them here a few at a time. optiontrading.tistory.com
Questions?
There are no comments or a guestbook here. Email me with questions about a post or to report an error — I read and reply. I don't give individual investment advice.
hello@optionphoenix.comRelated notes
- Picking the Two Strikes on a Long-Dated Put Backspread: Three Yardsticks, Worked Out
- Backspread vs. Ratio Spread — Price, Not Strike, Decides Which Leg You Sell
- I took the certain gain instead of the maximum one
- I lowered the win rate I need from 55% to 42% — by changing the average loss, not my hit rate