Theory
Picking the Two Strikes on a Long-Dated Put Backspread: Three Yardsticks, Worked Out
Once the two strikes are set, the character of this structure is mostly decided. I ran cost, delta and standard deviation on a 60-day example to see where they meet, what changes between a 1x2 and a 1x3, and why index put skew works against it. All numbers are model outputs.
A put backspread's character is mostly set the moment its two strikes are picked. One short, one long. If I pick them by feel, I won't even know what went wrong later.
So I split the decision into three yardsticks, worked each one out, and looked at where they meet. This post is the record of that calculation.
📌 Every option price and greek below is a Black-Scholes model output with an assumed put skew. None of it is a live quote. Assumptions: index at 7,690, 60 DTE, ATM IV 15%, multiplier 100. Commissions, taxes and margin are not included.
What a backspread is, and why its max loss sits at the long strike, I covered first in Backspreads and naked selling.
0. Why long-dated
| Greek | Sign | What it means |
|---|---|---|
| Vega | Long (+) | Gains when volatility rises — it can be profitable even if closed before expiration |
| Gamma | Long (+) | The bigger the move, the faster it accelerates |
| Theta | Short (−) | Sitting still costs a little every day — time works against you |
With short-dated options, theta eats the position too fast and there's no time to wait for the big move. At 60 to 120 DTE there is time to wait, and a rise in volatility alone can let me lock in a gain partway through.
That doesn't mean long-dated has no theta. Even the 60-day model below loses roughly $120 to $140 a day. The way I see it, the advantage of going long-dated isn't that theta is small — it's that the daily bleed is gradual enough to sit through.
1. The short leg — the expensive strike, near the money
The single short put goes at the strike closest to the current index. It's the most expensive one, so its premium is what pays for the two puts below.
In my calculations I used the 0.40 to 0.50 delta range — from at-the-money down to about 0.3σ below it. Moving it lower collects less premium, so the structure costs more. Moving it higher widens the max-loss zone.
2. The long leg — working out each of the three yardsticks
Yardstick 1: Cost — the zero-cost strike
The strike where the price of the two long puts equals the price of the one short put. At that strike, a rally doesn't cost me anything.
Yardstick 2: Delta — long delta × 2 ≈ short delta
Matched this way, the position is close to delta-neutral at entry, so it's a bet on the size of the move, not its direction. If the short put has a 0.46 delta, the long puts sit near 0.23.
Yardstick 3: Standard deviation — 1σ to expiration
1σ = index × IV × √(DTE ÷ 365)
| Time to expiration | 1σ (points) | % of index |
|---|---|---|
| 30 days | ~331 | 4.3% |
| 60 days | ~468 | 6.1% |
| 90 days | ~573 | 7.5% |
| 180 days | ~810 | 10.5% |
When I ran it, yardsticks 1 and 2 landed in almost the same place: on a 60-day expiry, roughly 0.5 to 0.7σ below the short strike. Go all the way down to 1σ and the trade actually opens for a credit — but the breakeven gets too far away.
3. Side by side: one short 7,690 put held fixed, only the long strike changing
| Long strike | Width | Entry | Max loss | Downside breakeven | Drop needed |
|---|---|---|---|---|---|
| 7,600 × 2 | 90 | 105.8 debit | $19,582 | 7,404 | −3.7% |
| 7,500 × 2 | 190 | 47.4 debit | $23,739 | 7,263 | −5.6% |
| 7,400 × 2 | 290 | 0.8 debit ≈ zero | $29,077 | 7,109 | −7.6% |
| 7,300 × 2 | 390 | 36.2 credit | $35,383 | 6,946 | −9.7% |
| 7,200 × 2 | 490 | 65.3 credit | $42,472 | 6,775 | −11.9% |
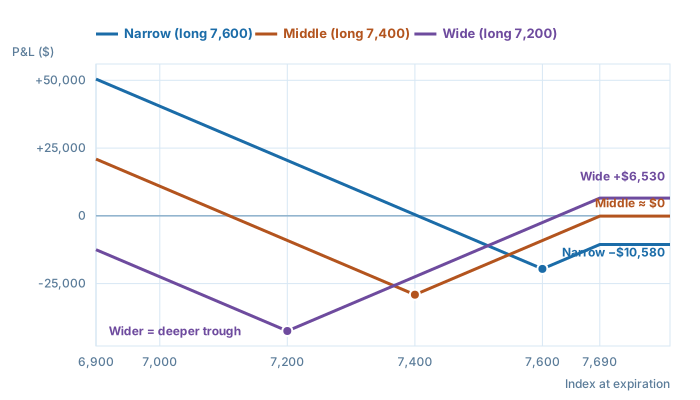
Here's what I read from the chart.
| Narrow (long strike higher) | Wide (long strike lower) |
|---|---|
| Breakeven is close (−3.7%) | Breakeven is far (−11.9%) |
| Paid a debit, so a rally loses money | Took a credit, so a rally makes money |
| Max loss in dollars is smaller | Max loss in dollars is larger |
| Delta leans short (directional) | Delta leans long |
What happens when the width gets extremely narrow
In the top row (width 90), the 105.8 debit is already larger than the 90-point width. Narrow it further and the two option prices converge, so combinations like this show up even more easily. That's the worst of both: you lose on the upside, and the downside breakeven moves farther away.
So I added a separate debit ÷ width column to my sheet, and set my own rule as not entering anything above 30%. In the table above, the 7,600 row (118%) fails that test, and from the 7,500 row (25%) on, it passes.
4. 1x2 or 1x3?
The breakeven formula answers this.
downside breakeven = long strike − (width + debit) ÷ (number of long contracts − 1)
Going to three long puts takes the denominator from 1 to 2, which halves the distance the index has to fall below the long strike — for the same cost. The catch is the extra contract: it raises the debit, and the higher debit pushes that distance back out a bit. So in the table below the drop needed goes from −5.6% to −4.7%, not to half. The max loss also gets larger.
| Structure (long 7,500) | Entry (debit) | Max loss | Downside breakeven | Drop needed |
|---|---|---|---|---|
| 1 × 2 | 47.4 | $23,739 | 7,263 | −5.6% |
| 1 × 3 | 156.3 | $34,629 | 7,327 | −4.7% |
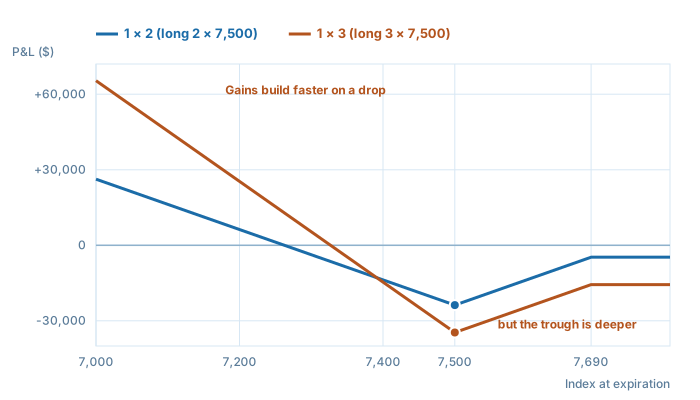
My takeaway: if the weight is on a large, fast selloff, 1x3; if the priority is keeping cost and max loss down, 1x2. The longer a long-dated position is held, the heavier the theta drag, so I run my numbers with 1x2 as the default.
5. Index put skew — why it works against this structure
On index options like SPX, IV rises as you go lower — that's put skew. The model above reflects it: the 7,690 put is at 15% IV, while I put the 7,200 put at 18.5%.
A put backspread is a structure that buys two of the cheaper option, but skew makes those downside puts more expensive than you'd expect. Skew works against this structure. That's why a zero-cost put backspread is hard to build on an index.
| Put backspread | Call backspread | |
|---|---|---|
| Index option skew | Unfavorable (downside is expensive) | Favorable (upside is cheap) |
| Getting to zero-cost | Hard | Easier |
| What works for it instead | A crash usually brings a volatility spike with it | In a rally, volatility tends to fall |
So on price alone, I think the better entry is when skew is compressed — when the market feels safe: VIX low and put skew flat.
6. The expiration and management rules I wrote down for myself
| Item | Rule |
|---|---|
| Entry expiration | 60–120 DTE |
| Close or roll | At 30 DTE — after that, the V-shaped trough at the long strike deepens fast |
| Taking gains early | When volatility spikes (no need to hold to expiration) |
| Stop-loss | At 50% of max loss, or when the reason for the trade no longer holds |
| Worst-case scenario | The index parking near the long strike into expiration |
As I see it, most of a backspread's profit comes not from the expiration payoff diagram, but from volatility expanding before expiration. Carrying it to expiration mainly raises the risk of settling right in the bottom of the V.
7. The six boxes I fill in before placing the order
- Is the short leg's delta within 0.40–0.50?
- Is the long leg's delta × 2 close to the short leg's delta?
- Is the debit within 30% of the strike width? (Zero or a credit is better.)
- Did I write down the drop needed to breakeven as a percentage?
- Is the max loss, in dollars, an amount my account can absorb?
- Did I decide in advance what I'll do at 30 DTE?
If it's unclear which side you're selling, start with Backspreads vs. ratio spreads.
⚠️ This is a record of what I calculate, and how, when I pick strikes. It is not investment advice and does not recommend any security or strategy. The prices and greeks in this post are model-generated examples and differ from real market quotes. Options trading can result in the loss of your entire investment. Your decisions and their outcomes are your own.
How was this to follow?
Knowing where it got hard is what lets me fix the next one. No name, no email.
Get the One-Page Options Field Guide
A strategy selector for bull, bear, and sideways markets, a pre-order checklist, and a glossary.
If this was useful
Why gamma, call walls, and put walls behave the way they do comes down to the structure of the options market. These books lay out that structure in order.
- Strategic US Options Trading I: Fundamentals — Start here if options are new — from reading the chain
- Strategic US Options Trading II: Strategies — When you want to actually place the order
- Strategic US Options Trading III: Advanced Strategies — When you want cash flow in a sideways market
Earlier posts live on Tistory. I'm moving them here a few at a time. optiontrading.tistory.com
Questions?
There are no comments or a guestbook here. Email me with questions about a post or to report an error — I read and reply. I don't give individual investment advice.
hello@optionphoenix.com