Theory
Backspread vs. Ratio Spread — Price, Not Strike, Decides Which Leg You Sell
Try to memorize whether you sell the higher or the lower strike and calls and puts will trip you up. I kept one sentence instead. Here's how it sorts the four structures, and how counting contracts tells me whether the risk is capped or open.
"In a backspread, do you sell the higher strike or the lower one?"
I tried to memorize the answer, and I mixed it up between calls and puts every single time. Eventually I stopped memorizing and kept one sentence.
Backspread = sell 1 expensive option, buy 2 cheap ones. A ratio spread (also called a front spread) is the exact mirror image — buy 1 expensive option, sell 2 cheap ones.
Which leg you sell isn't decided by whether the strike is higher or lower. It's decided by whether that option is the expensive one or the cheap one. This post is my record of sorting four structures with that one sentence.
📌 The strikes and option prices in this post ($40 · $12) are assumptions I picked to explain the structures. They are not real quotes. One contract = $100 per index point, held to expiration, with commissions and taxes left out.
1. Which one is expensive
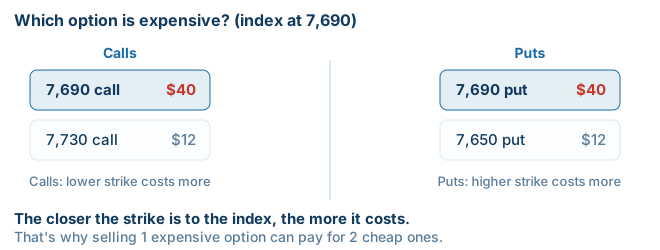
The expensive option is always the strike closer to where the index is right now. Calls and puts just point in opposite directions.
Calls   lower strike = more expensive    7,690 call $40  ·  7,730 call $12
Puts    higher strike = more expensive   7,690 put  $40  ·  7,650 put  $12
So the same rule, "sell the expensive one," means the lower strike for calls and the higher strike for puts. Almost all of the confusion comes from exactly this.
2. The four structures at a glance
| Structure | Sell | Buy | Move it's built for |
|---|---|---|---|
| Call backspread | Lower strike ×1 (7,690 call) | Higher strike ×2 (7,730 call) | A big move up |
| Put backspread | Higher strike ×1 (7,690 put) | Lower strike ×2 (7,650 put) | A big move down |
| Call ratio spread | Higher strike ×2 (7,730 call) | Lower strike ×1 (7,690 call) | A modest rise, then a stall |
| Put ratio spread | Lower strike ×2 (7,650 put) | Higher strike ×1 (7,690 put) | A modest drop, then a stall |
Counting contracts tells you what kind of risk it is
More contracts bought  →  backspread family     →  loss is capped
More contracts sold    →  ratio (front) spread family  →  loss is open
Whether the strike is high or low comes second. When I look at a position, this count is the first thing I check.
3. One structure at a time
Put backspread — built for a big drop
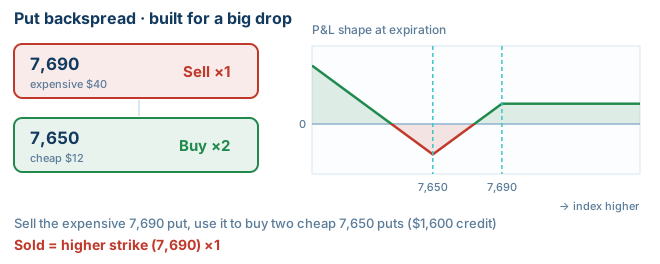
The structure sells the expensive 7,690 put and uses that premium to buy two cheap 7,650 puts. $40 − $12 × 2 = $1,600 credit.
Call backspread — built for a big rally
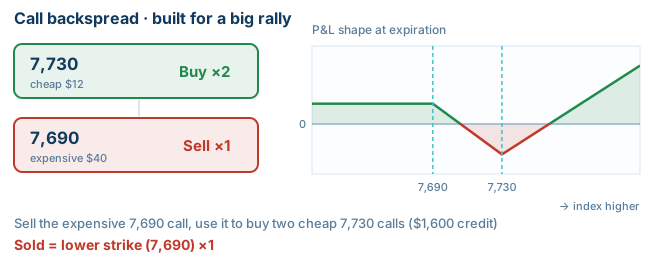
It sells the expensive 7,690 call and buys two cheap 7,730 calls. Again, $1,600 credit.
Put ratio spread — built for a modest drop
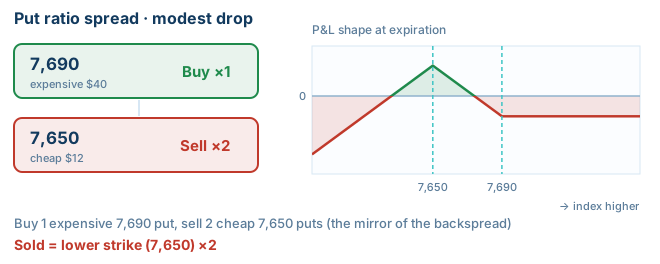
It buys one expensive 7,690 put and sells two cheap 7,650 puts. It points the opposite way from the backspread. The best outcome is the index stopping near 7,650; if it keeps falling below that, the one extra contract that was sold is what makes the loss grow.
Call ratio spread — built for a modest rise
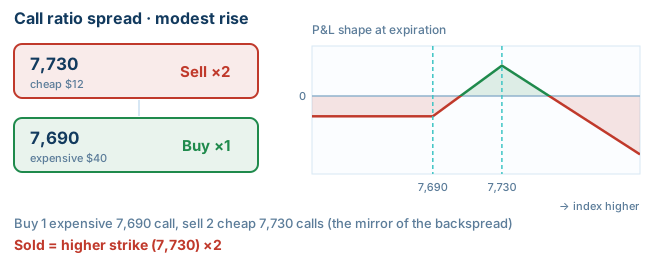
It buys one expensive 7,690 call and sells two cheap 7,730 calls. The sweet spot is near 7,730; if the index keeps climbing past it, there is no limit to the loss on the upside.
4. A combination that fits none of the four — selling two of the expensive one
After building the table, I ran the numbers on one more. Sell two of the expensive option, buy only one of the cheap one. This is a hypothetical example built from the same assumed prices — not a position anyone holds.
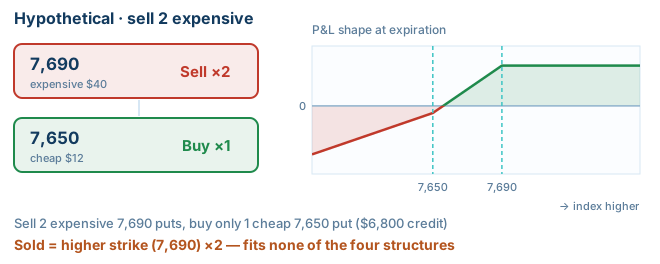
Sell  7,690 put × 2   @ $40   → +$8,000
Buy   7,650 put × 1   @ $12   → −$1,200
─────────────────────────────────────────
Credit                          +$6,800
That credit feels large. The combination doesn't match any of the four textbook structures above, but split it in two and you can see what it really is.
| Split into | Legs | What it is |
|---|---|---|
| ① Bull put spread | Sell 1 × 7,690 put + buy 1 × 7,650 put | The capped part · max loss (40 − 28) × 100 = $1,200 |
| ② Naked short put | Sell 1 × 7,690 put | The open part |
Most of that $6,800 credit comes from piece ②, which is to say it's payment for taking on open risk. Below 7,650, this combination behaves essentially the same as a single naked short put.
In this hypothetical, there are two ways to close the structure.
- Adding one more long put at a lower strike makes it 2 long · 2 short, which puts a floor under the loss
- Selling one fewer 7,690 put turns it into an ordinary bull put spread
Either way, the credit shrinks, but not by the same amount. Selling one fewer 7,690 put gives up $4,000; buying one more lower-strike put costs only that put's price. The way I read it, the credit given up is the cost of closing the risk that was left open.
5. Three things I count before I place the order
- Am I on the side that bought more, or the side that sold more?
- If I sold more, the excess contracts are uncovered
- Have I written down, in dollars, what that excess would lose on a single −5% gap day?
How I find the maximum-loss point on a payoff chart is in Backspreads and naked selling, and the math for choosing the two strikes off the index is in The two strikes of a long-dated put backspread.
⚠️ This is a record of how I tell option structures apart. It is not investment advice and does not recommend any security or strategy. The strikes and prices in this post are assumptions for illustration. Options trading can result in the loss of your entire investment, and structures with more contracts sold than bought can lose more than you put in. Your decisions and their outcomes are your own.
How was this to follow?
Knowing where it got hard is what lets me fix the next one. No name, no email.
Get the One-Page Options Field Guide
A strategy selector for bull, bear, and sideways markets, a pre-order checklist, and a glossary.
If this was useful
Why gamma, call walls, and put walls behave the way they do comes down to the structure of the options market. These books lay out that structure in order.
- Strategic US Options Trading I: Fundamentals — Start here if options are new — from reading the chain
- Strategic US Options Trading II: Strategies — When you want to actually place the order
- Strategic US Options Trading III: Advanced Strategies — When you want cash flow in a sideways market
Earlier posts live on Tistory. I'm moving them here a few at a time. optiontrading.tistory.com
Questions?
There are no comments or a guestbook here. Email me with questions about a post or to report an error — I read and reply. I don't give individual investment advice.
hello@optionphoenix.comRelated notes
- Picking the Two Strikes on a Long-Dated Put Backspread: Three Yardsticks, Worked Out
- Backspreads and Naked Selling — The One Point I Look for First on a Payoff Chart
- I put Friday's net call flow through one more filter — separating direction from expiration cleanup
- Two days with the same gamma — the two measurements that separated a trend from a range